Market Reports: Key Real Estate Trends Palm Beach County, Florida June 2025
June 23, 2025 Report With May, 2025 Stats
Curious if now’s a good time to sell—or if prices are rising in your neighborhood? Each month, we break down the latest real estate stats so you can make confident decisions, whether you’re buying, selling, or staying put. Stay updated with our Market Reports!
We’re seeing a shift in Palm Beach County, with inventory climbing and homes spending more time on the market. Some cities are in a Buyers Market now, whereas other cities are still in a Sellers Market.
We’re seeing more homes hit the market, which gives buyers more choices—but sellers still hold strong pricing power in Jupiter and Palm Beach Gardens
Staying updated on Florida’s real estate market trends is essential for making informed decisions when buying, selling, or investing. The market’s unique seasonal shifts, driven by factors like weather, taxes, and out-of-state buyers, can significantly impact property values and availability.
Video Housing Market Update
5 Counties in Southeast Florida
Update Released June 23, 2025 With May, 2025 Stats
Video by BeachesMLS and Realtors® Association of the Palm Beaches
Understanding these trends helps you time your transactions for maximum advantage—whether buying in the off-season for better prices or selling during peak demand. For investors, being aware of the latest trends enables you to identify profitable opportunities, from vacation rentals to long-term properties.
Having the knowledge of real estate market dynamics empowers you to make strategic, well-timed moves that can lead to financial success. Text or call The Martin Group 561-339-1779 or Email to schedule a FREE Consultation.
Palm Beach County, Florida
Snapshot Market Report & Real Estate Trends
Update Released June 23, 2025 with May, 2025 Stats
How these reports are made: Statistics are compiled by Realtors Association of the Palm Beaches using the BeachesMLS comparing the FULL previous year of properties for a specific month with the same month this year. The above data was released June 23, 2025 with May, 2025 stats
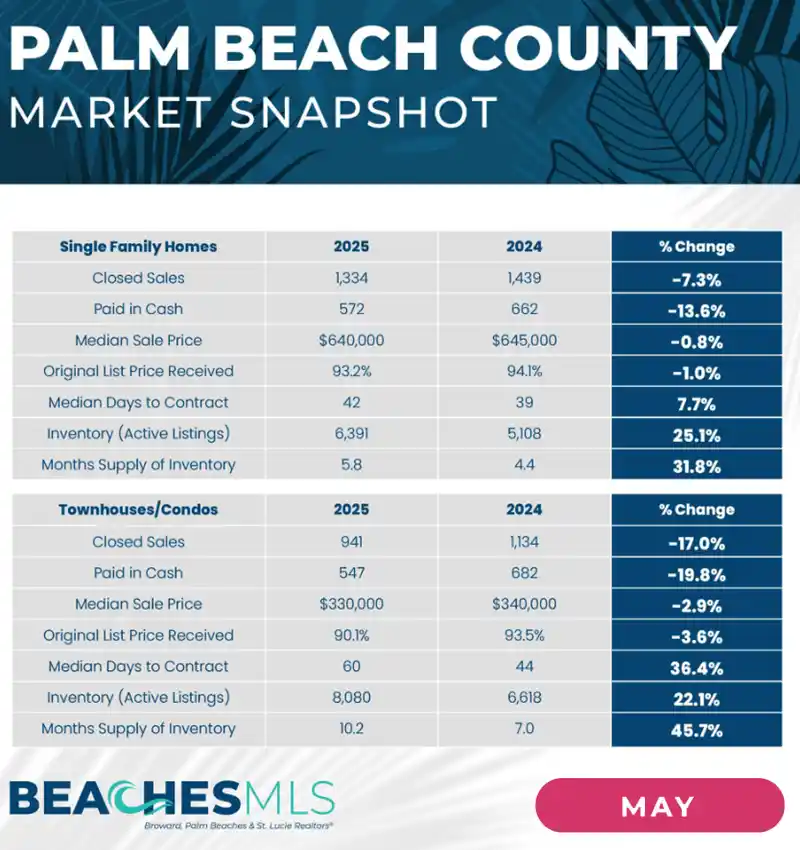
With a year-over-year increase in inventory, Palm Beach County currently active listings rose 25.1% year-over-year, reaching 6,391 homes on the market. Months’ supply of inventory also increased to 5.8, signaling a shift toward a more balanced market. However, closed sales dipped 7.3% compared to last May (1,334 vs. 1,439), reflecting hesitancy despite stronger inventory. Homes are also taking longer to sell: the median time from listing to sale rose to 86 days, up 2.4% year-over-year.
Wondering what this means for your home?
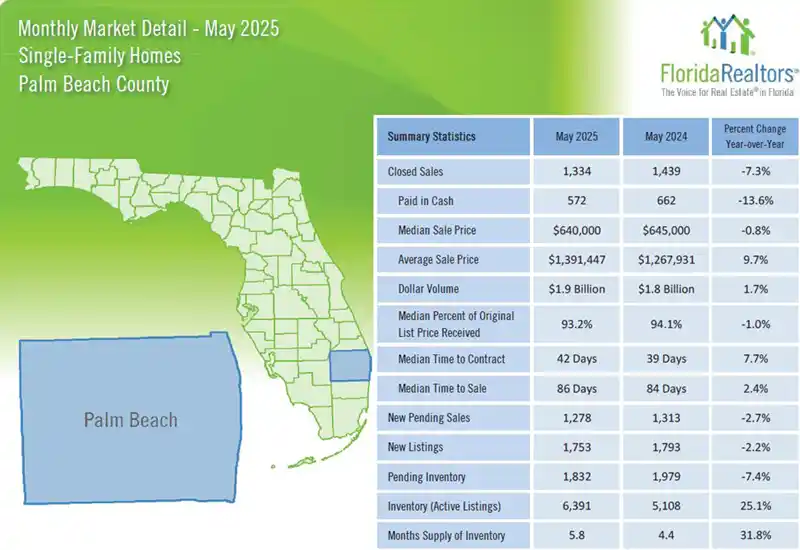
Single Family Homes Market Report
Palm Beach County, Florida
Released June 23, 2025 with May, 2025 Stats
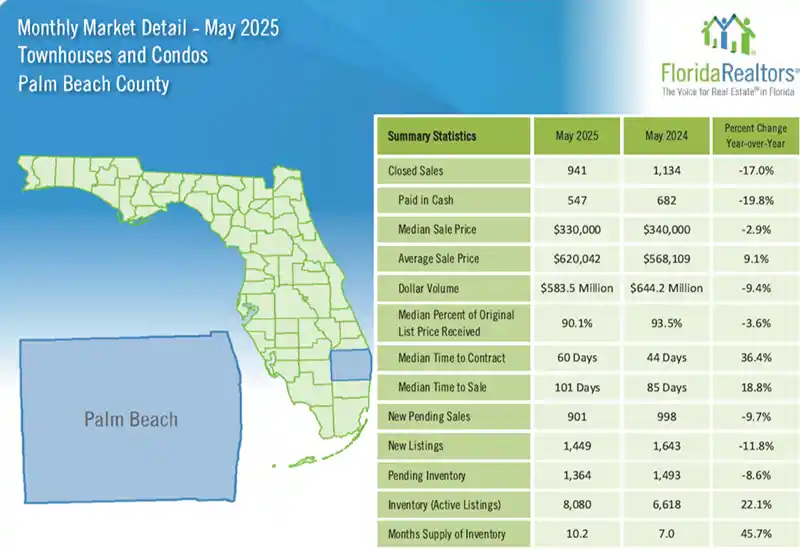
Condos & Townhouses Market Report
Palm Beach County, Florida
Released June 23, 2025 with May, 2025 Stats
Video Housing Market Report for Florida
Released June 23, 2025 With May, 2025 Stats
Video by Florida Realtors® Association
Palm Beach County SOLD PRICES Have Increased 11%-29%!
What is your home’s current market value?
Freddie Mac Mortgage Rates
April 1, 1971 to June 1, 2025. Rate was 6.81% on June 23, 2025 in South Florida

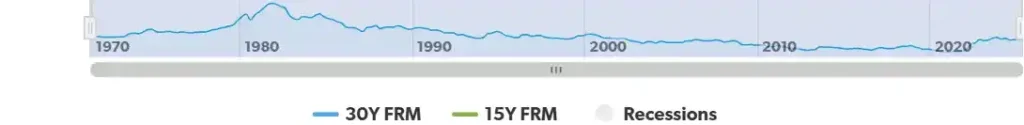
Chart is based on a 30Y FRM = 30 Year Fixed Rate Mortgage
Lowest Mortgage Rate was 2.65% on Jan 6, 2021
Highest Mortgage Rate was18.63% on October 8, 1981
Mortgage Rate average was 6.81% on June 23, 2025.
To view the latest update on mortgage rates, plus see 30 year chart, go to:
Freddie Mac Primary Mortgage Market Rates.
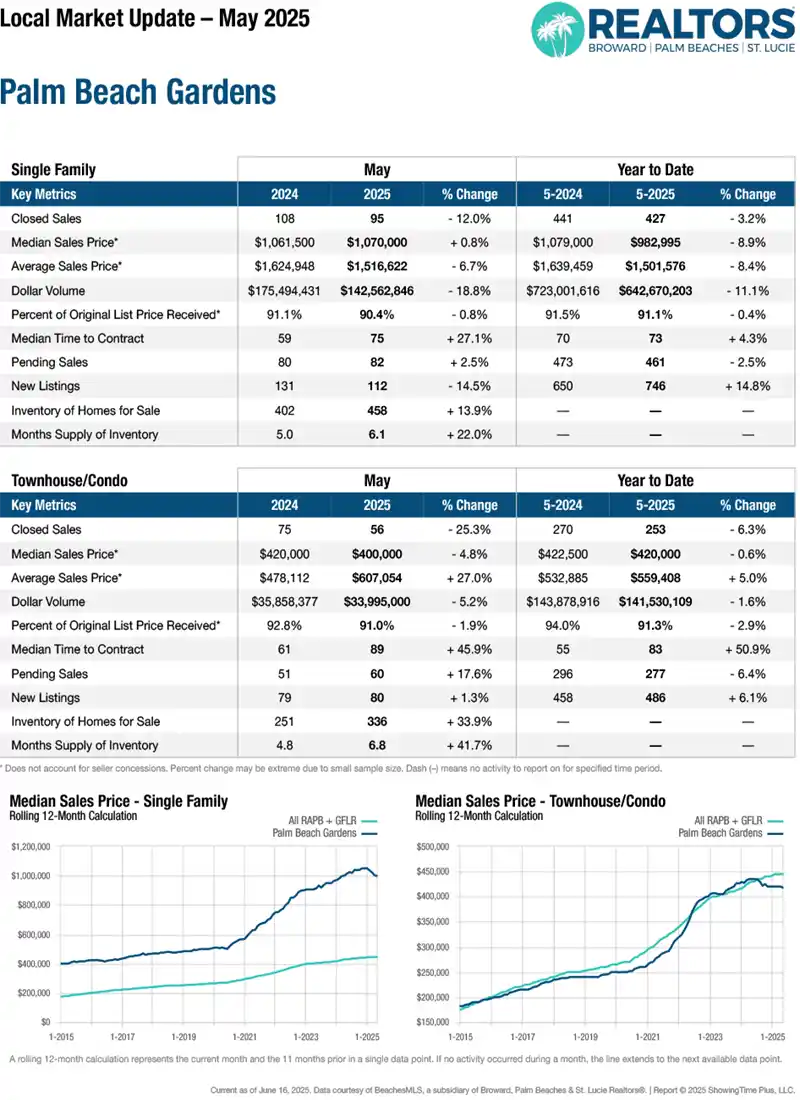
Palm Beach Gardens, FL Market Report
Released June 23, 2025 with May, 2025 Stats
Palm Beach Gardens, Florida Market Action Index
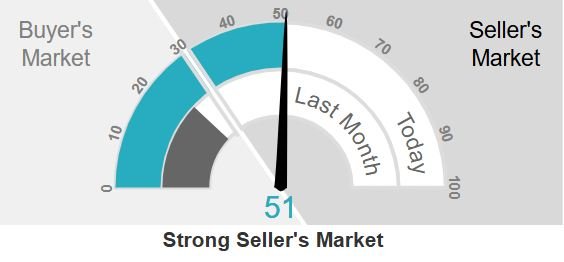
Buyer’s Market or Seller’s Market in Palm Beach Gardens?
The graph above compares rate of sales versus inventory. This week the median list price for Palm Beach Gardens, FL is $1,243,800 with the market action index hovering around 51. This is an increase over last month’s market action index of 24. Inventory has held steady at or around 407. Source: Michael Smith Marketing and Altos Research.
Want To Find Your Dream Home Now?
Insert Your Criteria to Search South Florida Homes & Condos
Call or text the Martin Group to learn more: 561-339-1779 or Email The Martin Group.
Contact The Martin Group of Realtors®
Let’s Chat!

Jason Martin & Doug Martin
Premier Brokers International
LOCAL EXPERTISE • GLOBAL REACH
50+ years of experience as Realtors® and Custom Home Builders.
Helping you reach your real estate goals!
Jason Martin, PA
Residential Realtor® Agent
561-624-4544
Email Me
Doug Martin
Broker Realtor® Emeritus
561-339-3299
Email Me