Video Housing Miami Market Update
Southeast Florida
Update Released August 22, 2025 With June, 2025 Stats

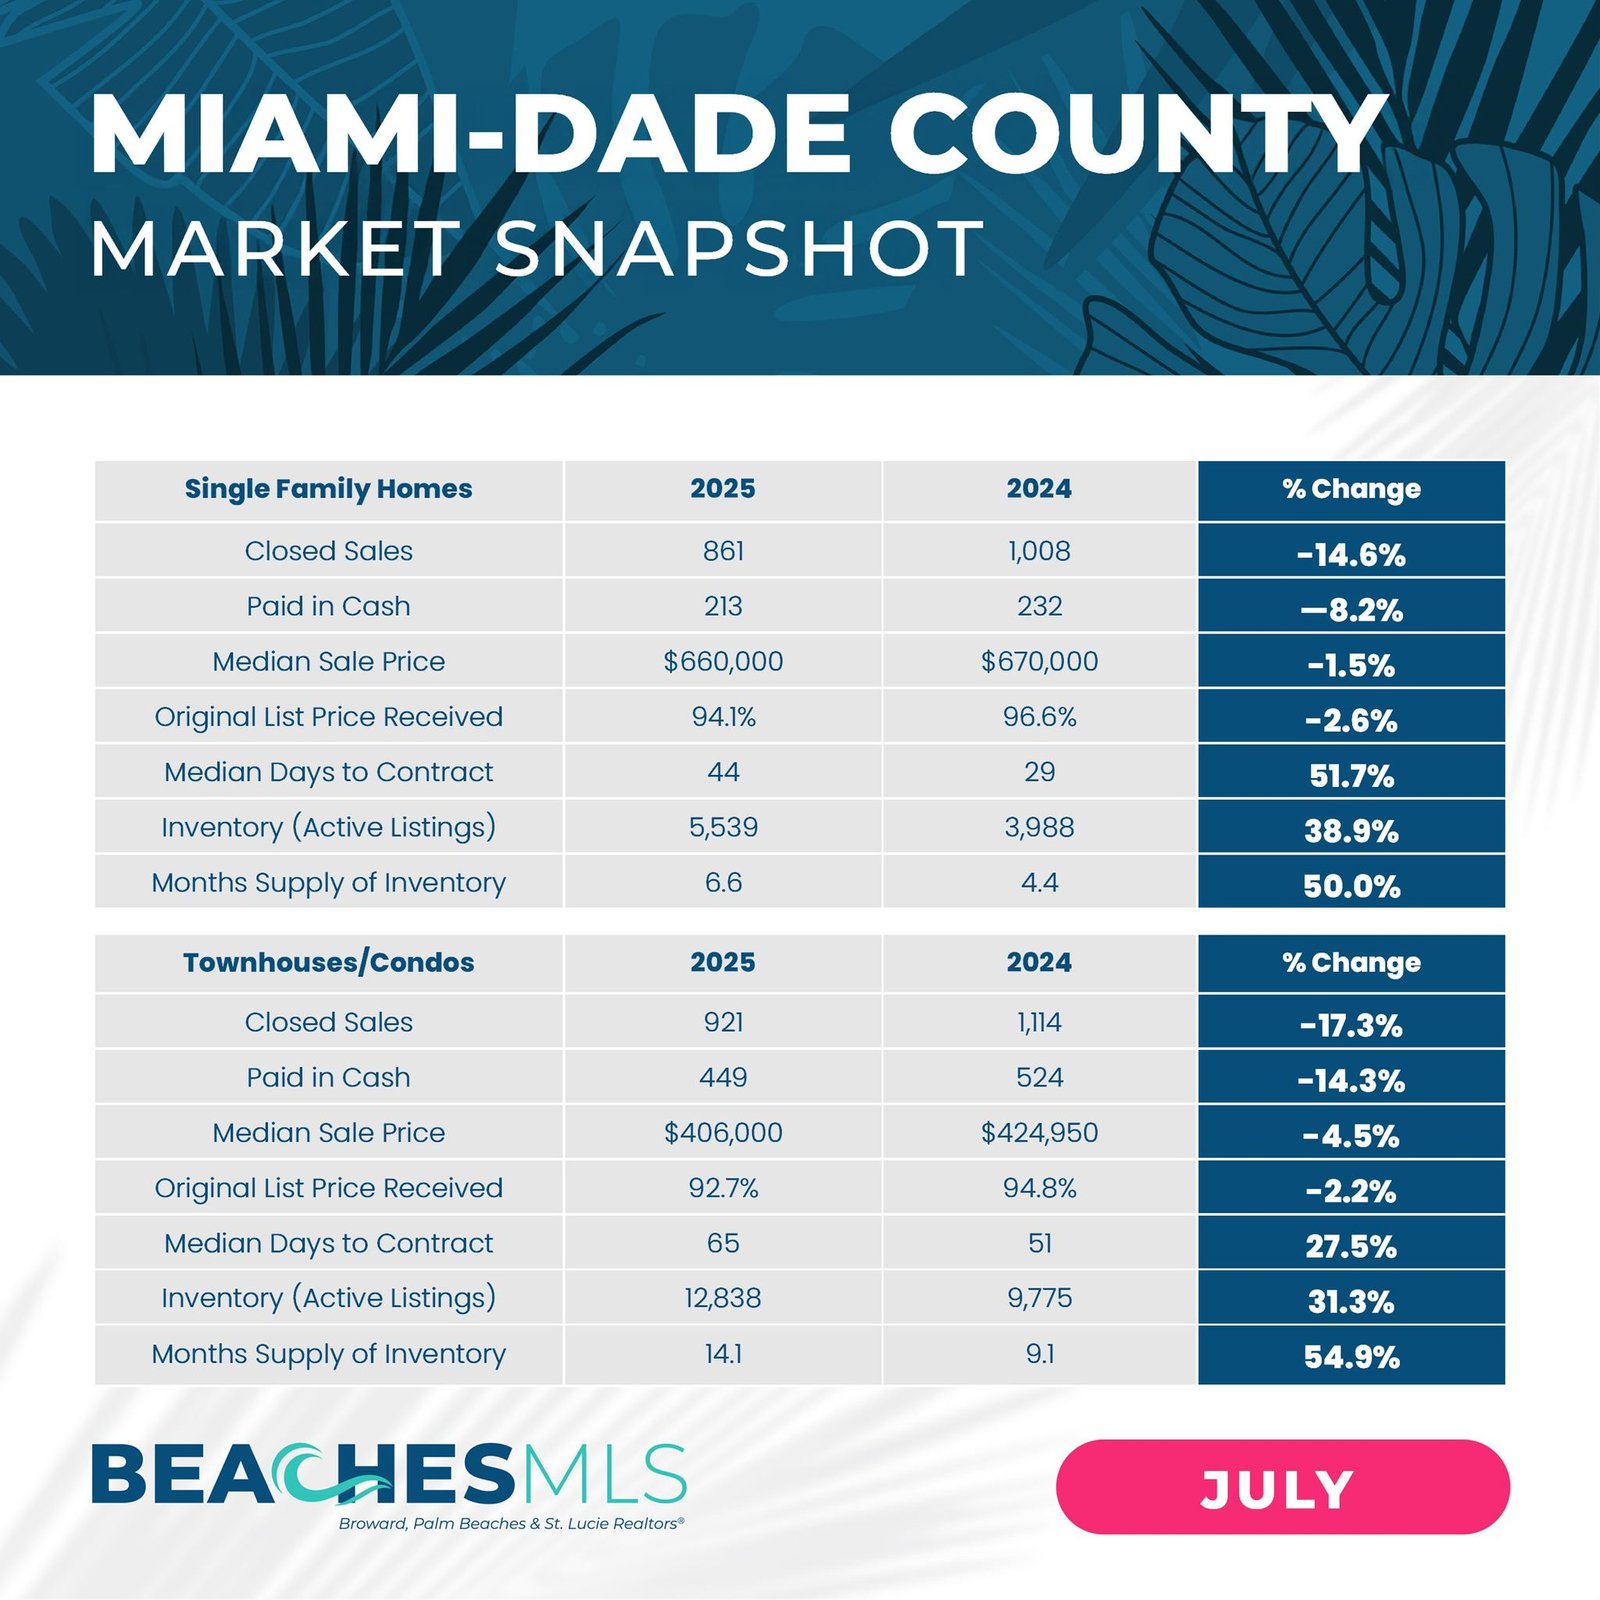
Homes: Closed Sales are Down -14.6% Median Sale Price is Down -1.5% for an median sale price of $660,000, and Inventory is Up 50.0% with 6.6 Months supply of Inventory.
Condos: Closed Sales are Down -17.3%, Median Sale Price is Down -4.5%, for a median sale price of $406,000. and Inventory is Up 31.3% with 14.1 Months supply of Inventory which indicates a buyers market.
Released: August 22, 2025 with July, 2025 Stats
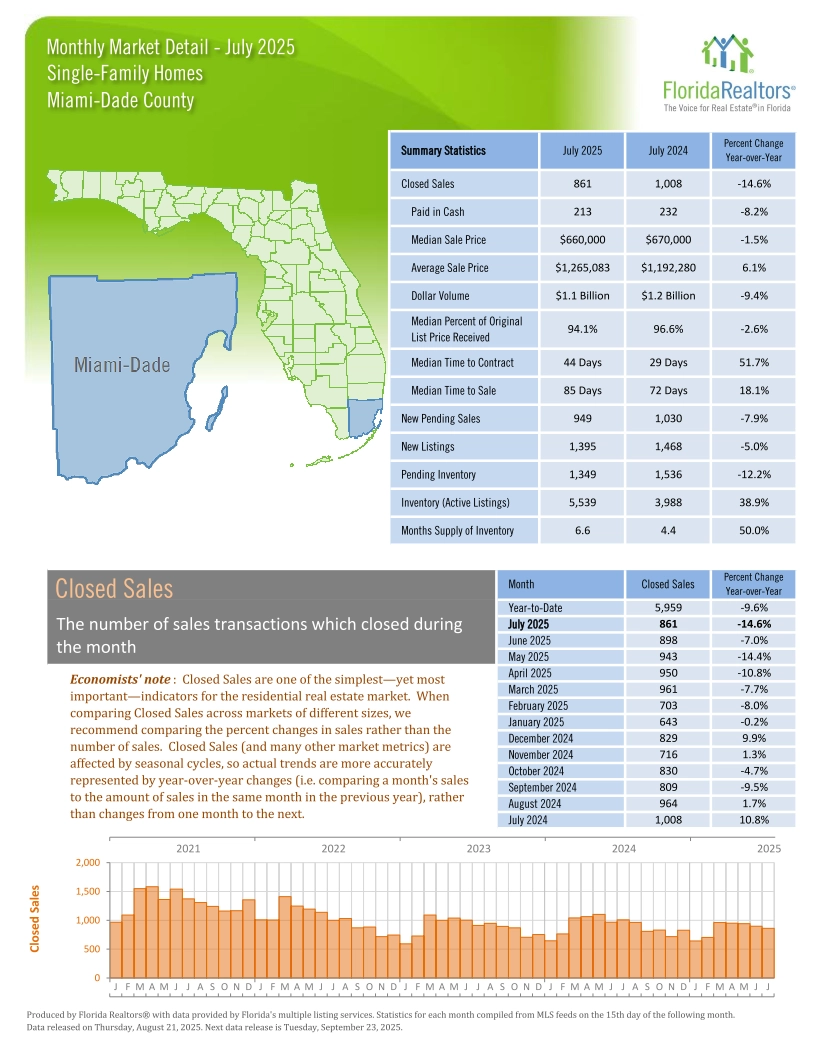
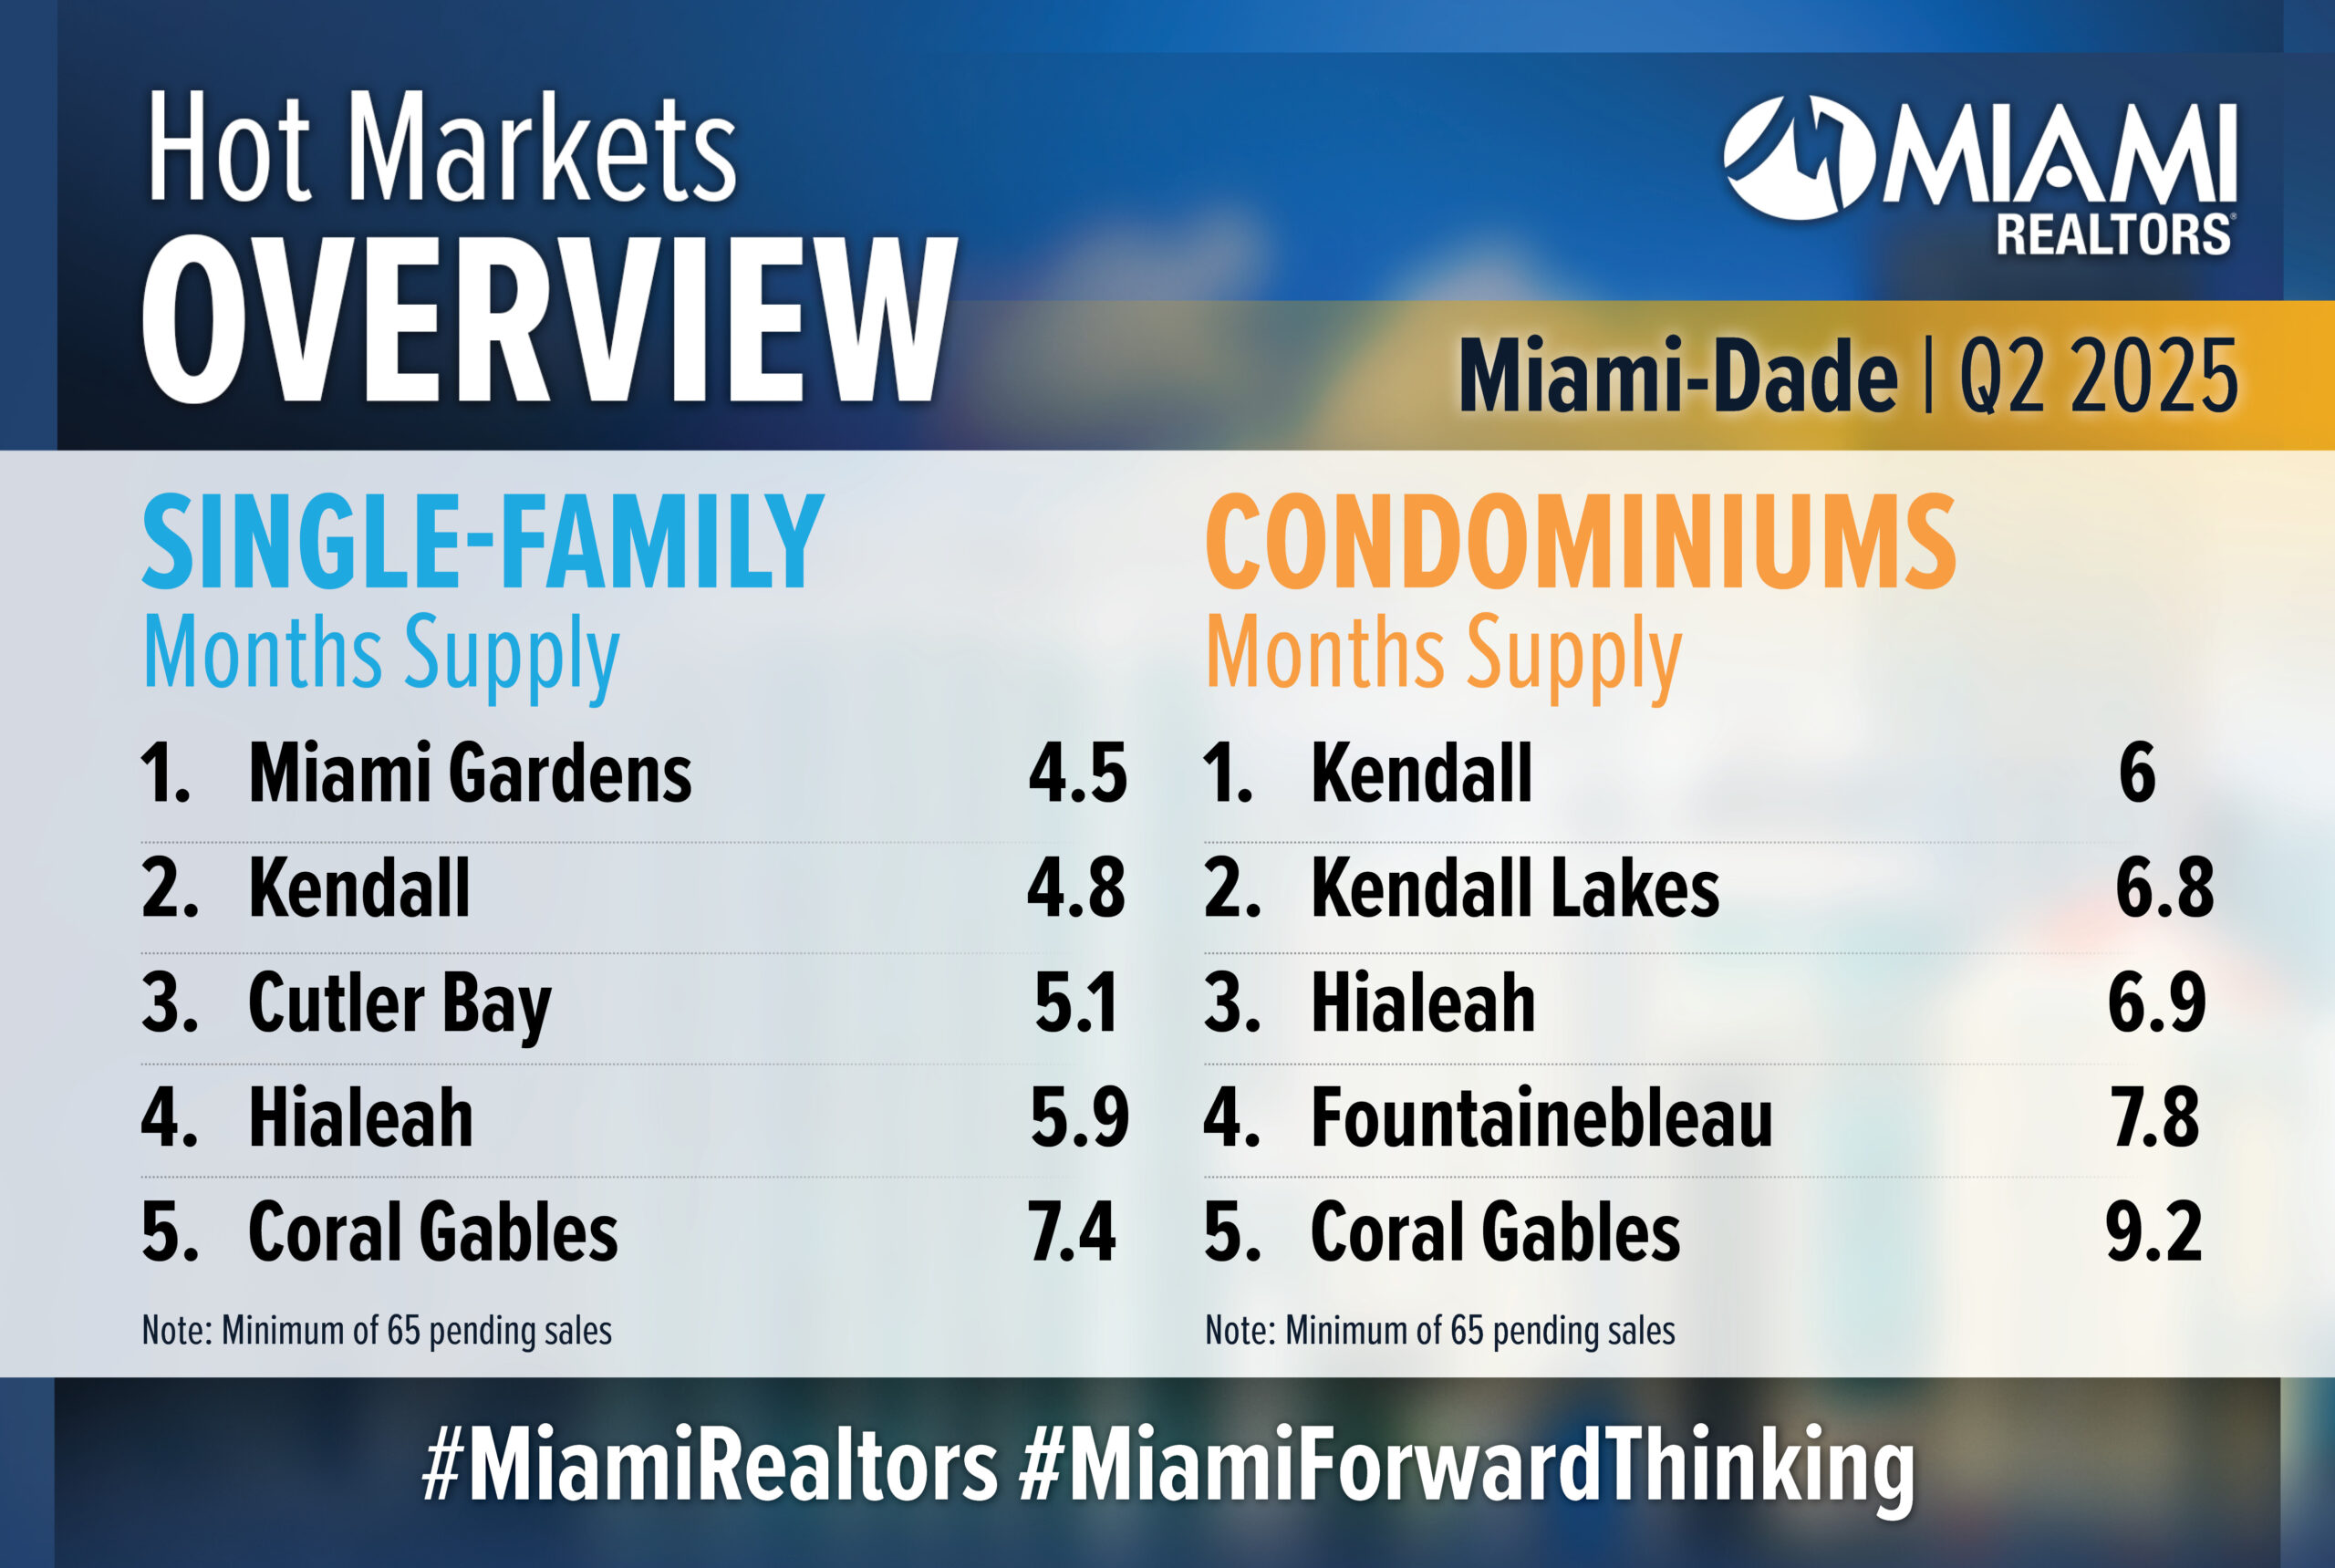
The July 2025 Miami-Dade County single-family home market reveals significant shifts:
Understanding these trends can help buyers, sellers, and investors make informed decisions in a shifting market. Dive deeper into inventory, pricing, and sales performance for actionable insights.
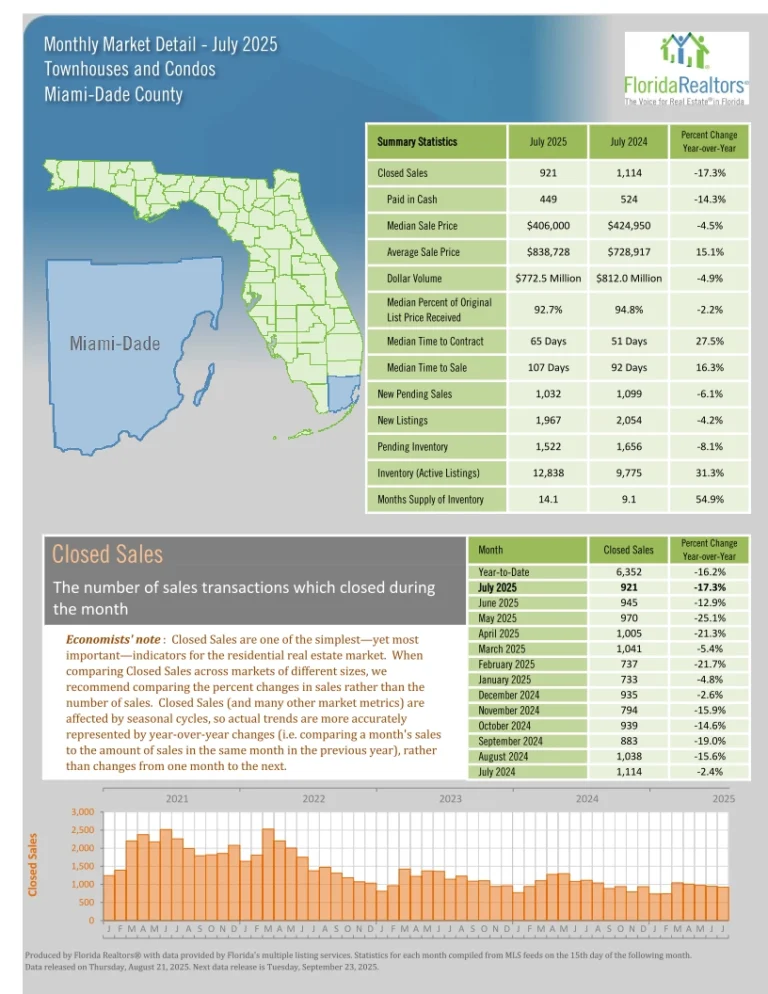
This data reflects the real estate market for townhouses and condos in Miami-Dade County as of July 2025.
Miami total Home Sales Decreased -16%, Single Family Home Sales Decreased -14.6%, Condo transactions decreased -17.3%. Total active listings are up 33.5%. Miami-Dade County’s single-family home active inventory continued to increase in July 2025, with active listings rising +38.9% year-over-year to reach 5,539 homes listed and 6.6 months supply of inventory which is a balanced market. The average sales price for Single Family Homes is down -1.5% at $660,000. This downward trend offers buyers increased leverage and a wider selection of homes, while sellers have more competition.
Miami-Dade County’s condo/townhome active inventory increased in June 2025, with active listings rising +31.3% year-over-year to reach 12,838 condos/townhomes listed and 14.1 months supply of inventory which is a Buyer’s market. The average sales price for a Townhouse/Condo is down -4.5% with an average price of $406,000. This downward price trend offers buyers increased leverage and a wider selection of condos, while sellers have more competition.
Staying updated on Florida’s real estate market trends is essential for making informed decisions when buying, selling, or investing. The market’s unique seasonal shifts, driven by factors like weather, taxes, and out-of-state buyers, can significantly impact property values and availability.,
Update Released August 22, 2025 With June, 2025 Stats
Understanding these trends helps you time your transactions for maximum advantage—whether buying in the off-season for better prices or selling during peak demand. For investors, being aware of the latest trends enables you to identify profitable opportunities, from vacation rentals to long-term properties.
Having the knowledge of real estate market dynamics empowers you to make strategic, well-timed moves that can lead to financial success. Text or call 561-339-1779 or Email to Schedule a FREE Consultation.
Videos/Reports by Miami Realtors Association® & Beaches MLS and Realtors® Association of the Palm Beaches
Update Released August 22, 2025 with July, 2025 Stats
How these reports are made: Statistics are compiled by Realtors Association of the Palm Beaches using the BeachesMLS from the FULL previous year of properties. The sold data was released April 24, 2025.
Released August 23, 2025 with July, 2025 Stats
Other Reports
June 2025 Market Report PDF
June 2025 Hot Markets Report PDF
June 2025 Single Family Homes & Condos Report PDF
Miami Association of Realtors®
What is your home’s current market value?
April 1, 1971 to March 27, 2025. Rate was 6.8% on April 24, 2025 in South Florida
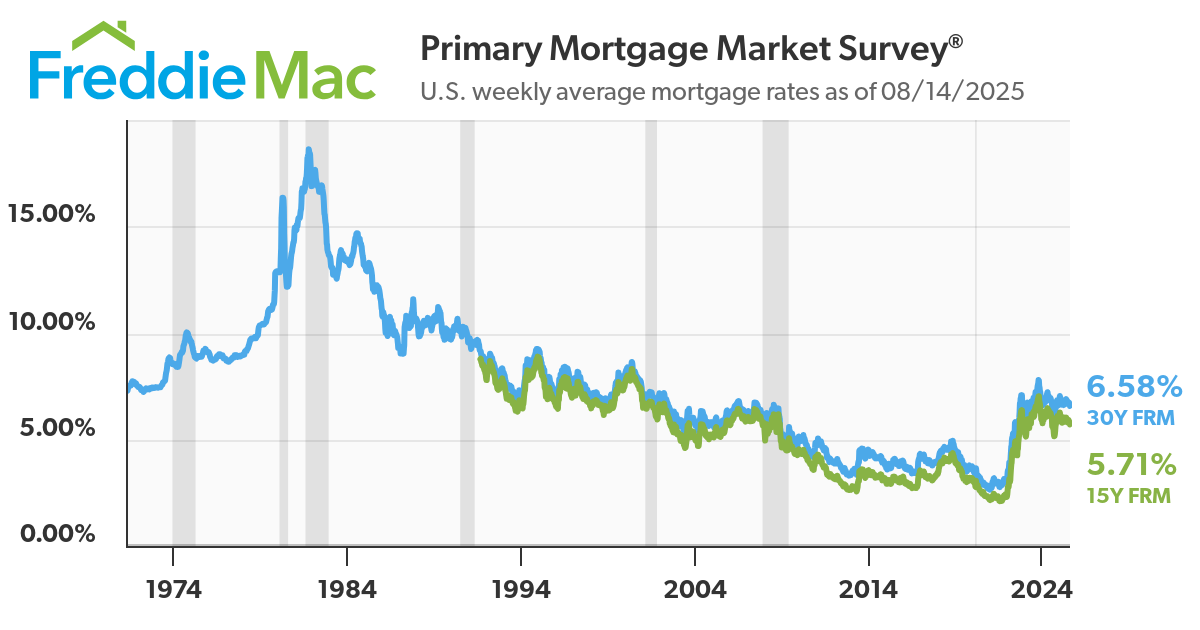
Chart is based on a 30Y FRM = 30 Year Fixed Rate Mortgage
Lowest Mortgage Rate was 2.65% on Jan 6, 2021
Highest Mortgage Rate was18.63% on October 8, 1981
Mortgage Rate average was 6.58% on August 14, 2025.
To view the latest update on mortgage rates, plus see 30 year chart, go to:
Freddie Mac Primary Mortgage Market Rates.
Let’s Chat!

Jason Martin & Doug Martin
Premier Brokers International
LOCAL EXPERTISE • GLOBAL REACH
50+ years of experience as Realtors® and Custom Home Builders.
Helping you reach your real estate goals!
Jason Martin, PA
Residential Realtor® Agent
561-624-4544
Email Me
Doug Martin
Broker Realtor® Emeritus
561-339-3299
Email Me