Video of Current South Florida Housing Market Update
Palm Beach County, Florida December 19, 2024 Update with November, 2024 Stats
Video by BeachesMLS and Realtors Association of the Palm Beaches
MARTIN GROUP OF REALTORS®
Local Expertise • Global Reach
+1-561-339-1779
Scroll down to view several different images, reports, and video.
Palm Beach County, Florida December 19, 2024 Update with November, 2024 Stats
Video by BeachesMLS and Realtors Association of the Palm Beaches
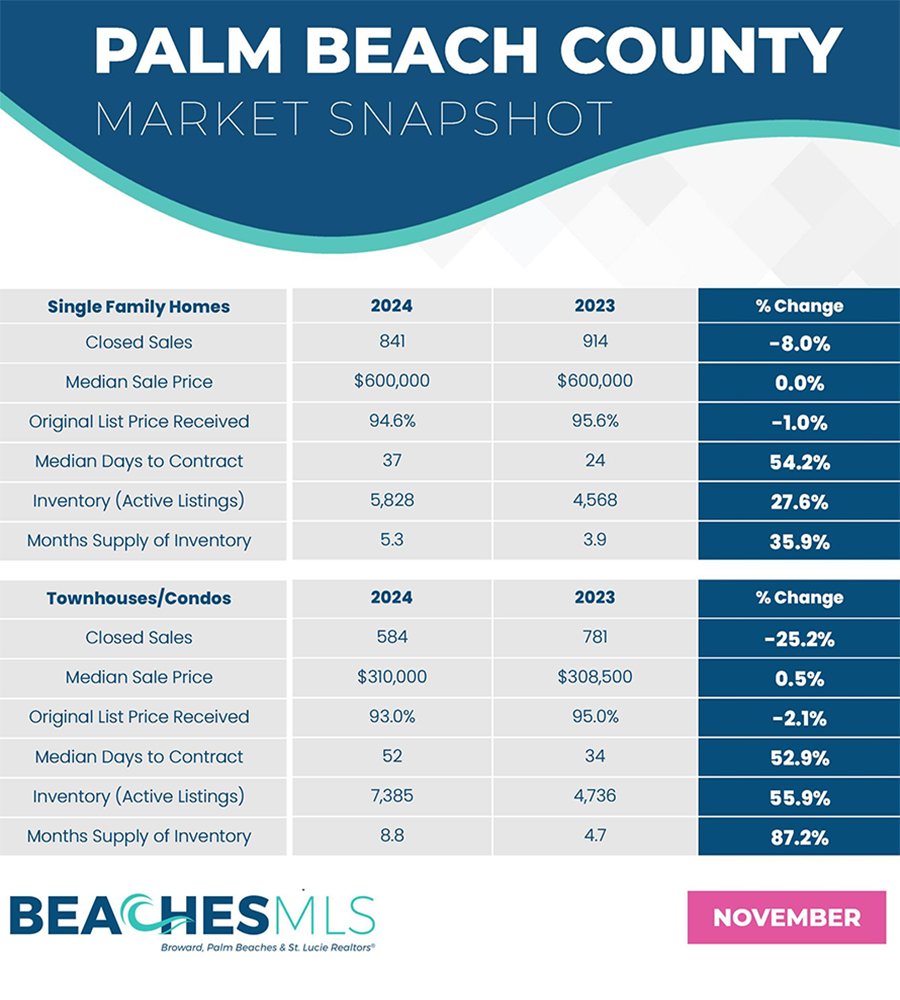
In Palm Beach County, Florida there was a 6% increase in months’ supply of inventory from this time last month, which is currently at 5.3 months. At the same time, the county saw an increase in dollar volume in 2024 compared to 2023, which is currently at $905.7 million.
Palm Beach County saw an increase of active listings with 5,828 this month and 1,610 of those listings being new. This is a 4.6% increase from last month.
How these reports are made: Statistics are compiled by Realtors Association of the Palm Beaches using the BeachesMLS from the FULL previous month of properties. The sold data was released December 19, 2024 and shows the stats from the previous full month of November.
The changing seasons in south Florida is bringing unusual seasonal opportunities for buyers due to falling mortgage rates and increased inventory. In Palm Beach County, the months supply of inventory currently sits at 5.3 months, a 35.9% increase from this time last year with 5,828 active listings.
Palm Beach County closed 841 sales in November, with the median time to contract being 37 days as buyers sift through options. More listings are hitting the market each month. The median sale price stayed fairly consistent with this time last year at $600,000.
What Do You Think Your Home Is Worth Now?
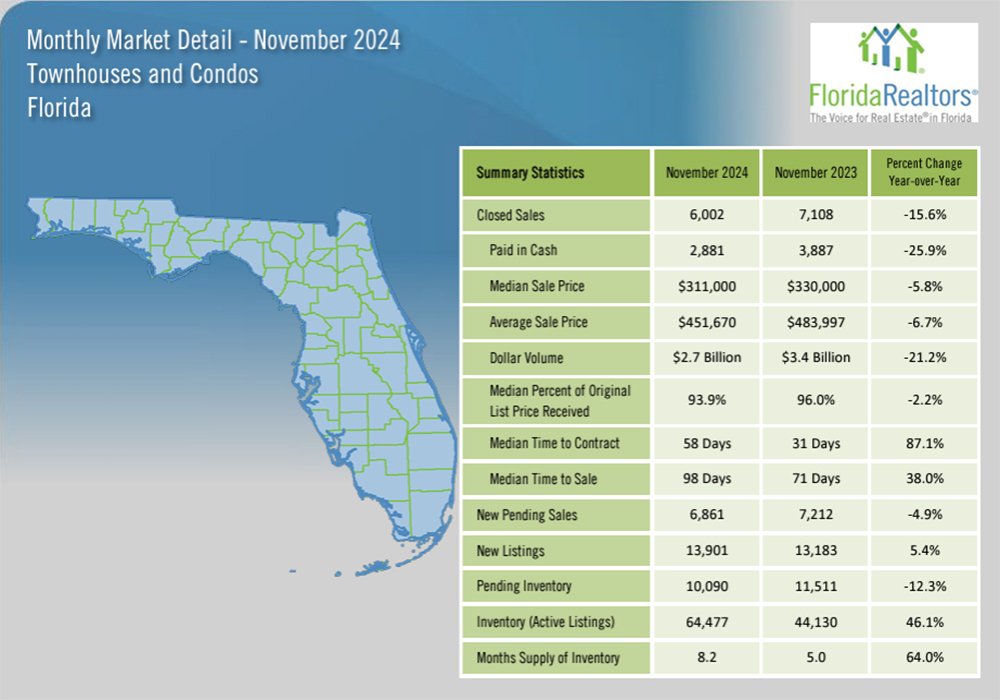
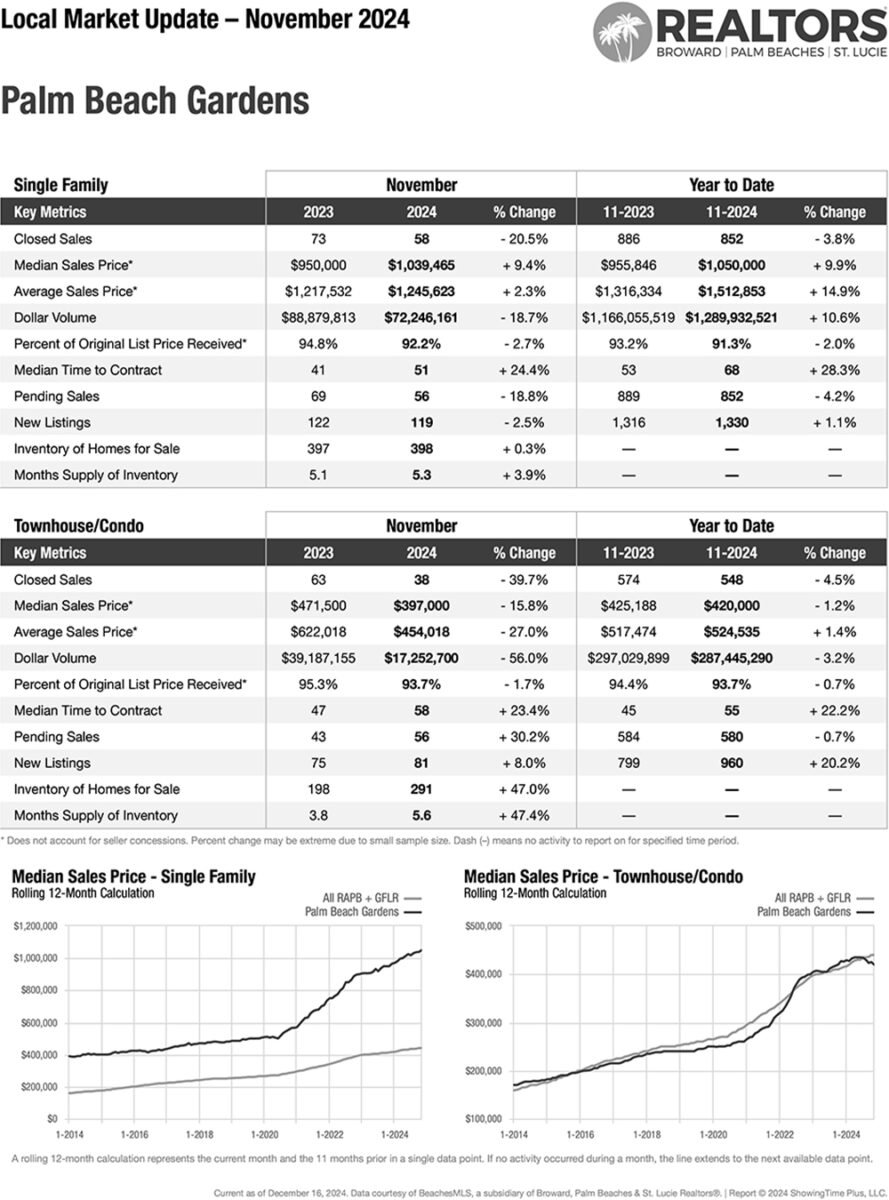
View the stats of Palm Beach County by separating the Single Family Homes from the Condos.
Palm Beach County Single Family Homes December 2024 Report with November Data.
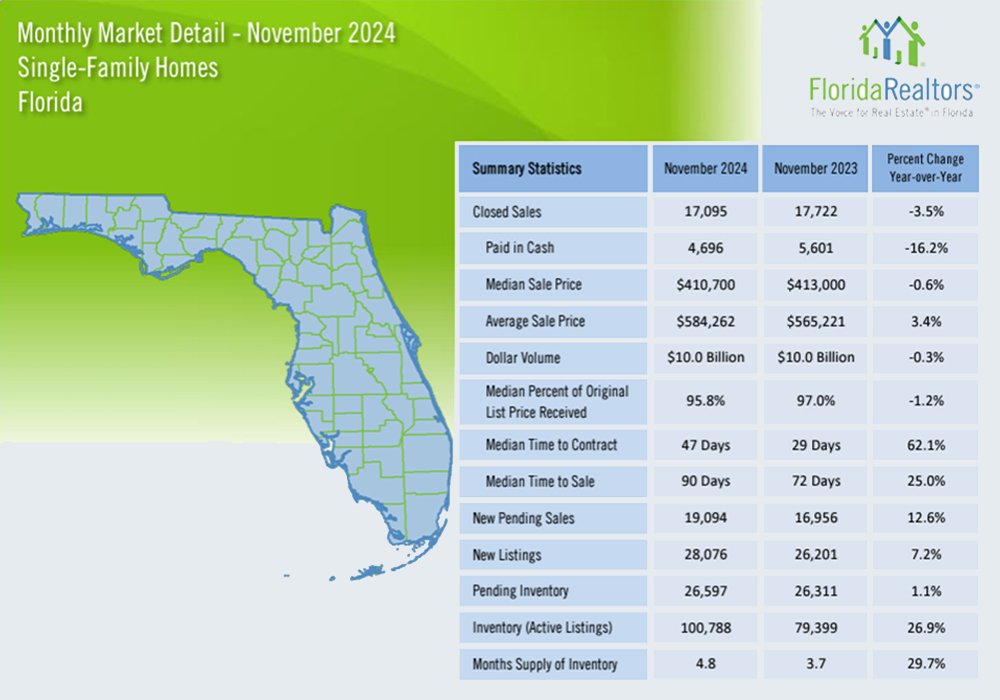
Palm Beach County Condos & Townhouses December 2024 Report with November Data.
April 1, 1971 to December 19, 2024
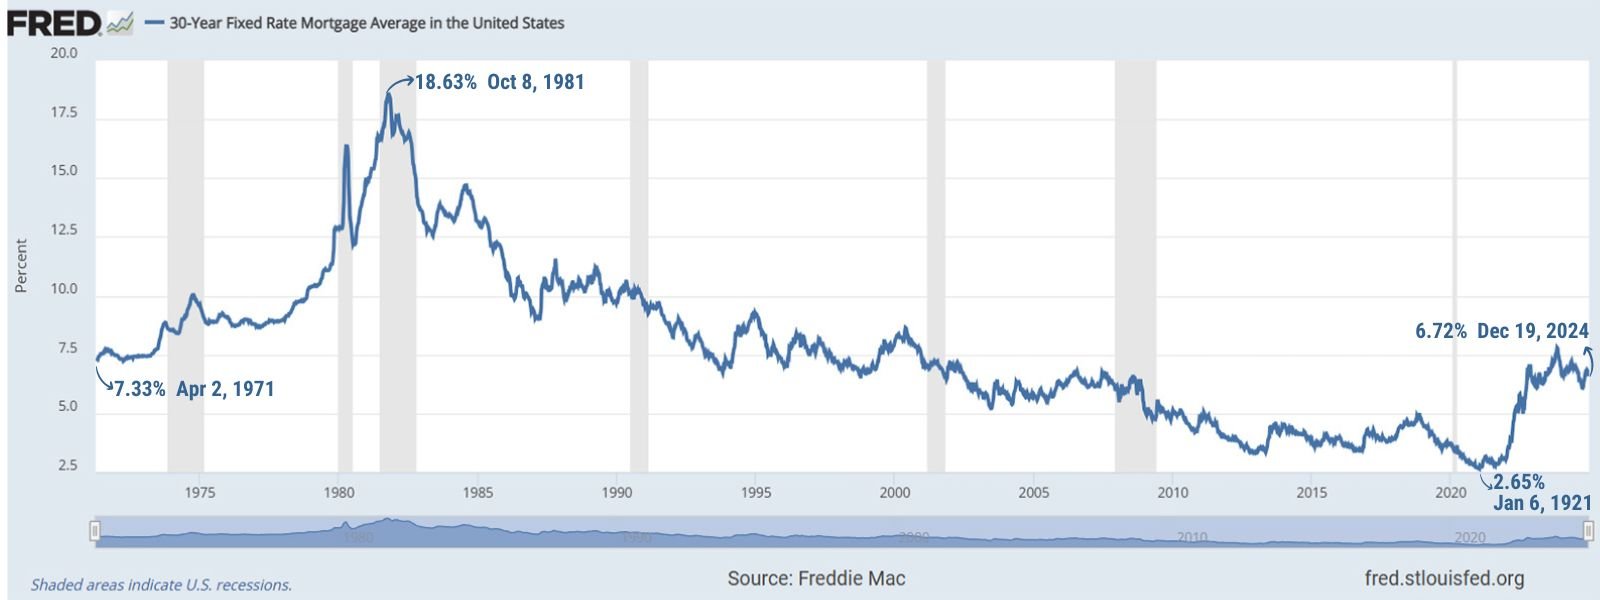
Lowest Mortgage Rate was 2.65% on Jan 6, 2021
Highest Mortgage Rate was 18.63% on October 8, 1981
The chart is based on a 30Y FRM = 30 Year Fixed Rate Mortgage
Mortgage Rate averaged at 6.72% on December 19, 2024.
To view the latest update on mortgage rates and to see the 30 year chart, go to:
Freddie Mac Primary Mortgage Market Rates.
Graphics below give a quick visual and answer the question of “How’s the Market?” by comparing the rate of sales versus inventory. The examples are for Palm Beach Gardens over a 20 month time period… gradually going from a very strong point of the seller’s market in June 22, 2022 (highest point in the last 2-1/2 years for Palm Beach Gardens) to a very slight seller’s market on December 19, 2024, down 22 points.
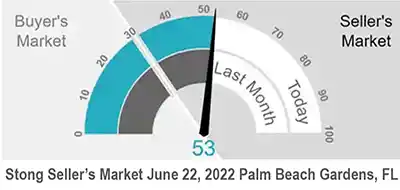
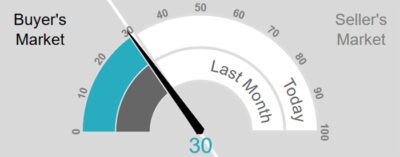
Slight Seller’s Market December 20, 2024 Palm Beach Gardens, FL
This week the median list price for Palm Beach Gardens, FL is $1,277,000 with the market action index hovering around 30. This is less than last month’s market action index of 31. Inventory has increased to 340 listings.
Inventory and sales are the key indicators! The market has been cooling off a bit in recent weeks, as more homes are available and demand is less. We’re already seeing prices move lower as a result. Expect this trend to continue especially if the index falls to the Buyer’s zone.
Watch for a persistent up-turn in Market Action to signal prices rising again. Get the Housing Market Action Index for your city or zip code below.
Ready to Buy, Sell, Rent, or Invest in Real Estate?
Let’s chat!

LOCAL EXPERTISE • GLOBAL REACH
40+ years of experience as Realtors® and Custom Home Builders
Helping you reach your real estate goals!
Residential Realtor® Agent
561-624-4544
Email Me
Realtor® Emeritus Broker
561-339-3299
Email Me